Search Results: "Ian Wienand"

6 August 2013

Ian Wienand: Running cloud images locally

Fedora and Ubuntu both provide compact cloud images that are useful for spinning up small VM's quickly (much quicker than installing from a huge ISO or even net-install). Both these pages have single-click buttons to simply launch the VM's at Amazon, which is very cool. However, you may have reason to use them "offline" with a local KVM (outside of EC2 or OpenStack) for testing, or on a plane, etc. I didn't find a lot of information on this (although it is all available once you know what you're looking for). So here's my quick guide for the complete newbie. Firstly, download your image of choice and put it in /var/lib/libvirt/images. Open up virt-manager and you can create your new VM via "import existing image". You can try booting it, but the problem you'll hit is the images have no default password or way to log-in because, very sensibly, you're expected to inject that. Booting you'll see cloud-init attempting to contact 169.254.169.254 to collect the meta-data to initalize the VM; eventually it will time out and you're left at a login prompt you can't log in at. cloud-init does many things and is very flexible with lots of different plugins to initialise images in various ways. The particular one we're interested in is the No cloud plugin. This will look for data from a locally attached CD drive, which works very easily for this scenario. Now that you know that's what you're looking for, the instructions are fairly clear; I'll repeat them just for clarity. Firstly you want to create a minimal meta-data file that has a host-name and an instance-id:
$ cat meta-data
instance-id: iid-local01;
local-hostname: myhost;
Modifying the instance-id will signal to cloud-init that it should run again because something changed. This is also where you can put static IP address data; see the documentation. Secondly, create a user-data file that has the commands to enable password login; set a password, and inject your ssh public key so you can easily log-in:
$ cat user-data
#cloud-config
password: mypassword
ssh_pwauth: True
chpasswd:   expire: False  
ssh_authorized_keys:
  - ssh-rsa ... foo@foo.com (insert ~/.ssh/id_rsa.pub here)
Note for new players: that #cloud-config isn't an optional comment, it's a directive. If you leave it out, you'll probably see a little something about Unhandled non-multipart userdata starting... and your changes won't apply. Insert those two into files into an iso:
$ genisoimage -output init.iso -volid cidata -joliet -rock user-data meta-data
Then copy init.iso into /var/lib/libvirtd/images as well, and connect that as a virtual-cd drive to your virtual-machine created from the image. When you boot you should see some output as it injects your key. It should get an address via DHCP and then you should be able to log-in with fedora or ubuntu users. Then you can start getting more complicated with things like static addresses, package installations, running commands, etc by reading the documentation.

5 August 2013

Ian Wienand: Skipping bash history for command-lines starting with space

I was recently reading about a case where part of the evidence appears to be a deleted bash history-file. From what I gather, the accused says that the removal was a clean-up job to remove inadvertently stored passwords rather than an attempt to hide nefarious activity. What had managed to pass me by in 15 or so years of using bash but not reading man bash properly is the HISTCONTROL variable. If it is set to ignorespace then commands entered with a leading-space will not be stored in the history. Like all the best discoveries I found this only by accident on a machine where it was turned on. It's been quite useful in keeping my history pruned. However, not usually for security reasons around hiding passwords passwords on the command-line have other problems and I'm sure any security person would tell you not to use them just from a defense-in-depth perspective. That said, from a "keeping ctrl-r reversi-search useful" point-of-view it's often helpful; for example I've mostly trained my fingers to <space>rm -rf because I'm sure I'm not the only one who has deleted the wrong thing via a history-recall-combined-with-typing-to-fast scenario. So, HISTCONTROL=ignoreboth (which also ignores duplicates) is certainly a useful one to slip into your .bashrc. At least it would be one-less thing to explain to the FBI!

26 July 2013

Ian Wienand: Converting an American propane appliance to Australian gas bottles

Here's something I just spent too much time figuring out... If you have an Australian "gas" or "LPG bottle"; the type you'd pick-up at any "service" or "petrol" station in Australia, it has a female POL connector. I'm not sure what POL stands for; possibly related to some company who made connectors long ago and it became standard. If you have an American "propane" device such as a grill, turkey fryer or smoker, or indeed something that plugs into a "propane bottle" you would pick-up at a "gas station" -- it will have a "Type 1", "ACME", "ACME Type 1", "QCC", "QCC1" or "QCC Type 1" connector (each seems to be an interchangeable term for the other). The appliance side of this has a big (usually black) plastic nut that is apparently safer or something. Once you have figured this out, you can buy something like the "Grillpro Model 11051 Universal Fit Propane Tank Adapter" and I can attest, based upon empirical evidence, that things will "just work". Of course your other choice might be just to replace the regulator, hoses, etc.; however if everything seems super-glued together the adapter is much easier. In other empirical evidence you won't find anywhere else on the internet : the Vizio M3D550KD LCD television works just fine on 240V, despite not being rated for it on the back.

23 May 2013

Ian Wienand: Stuck keyboard with Fedora 17 under VirtualBox

For a while now, I've been plagued with this ridiculous problem of the keyboard becoming "stuck" in my Fedora 17 VM running under VirtualBox. Keys would stop working until you held them down for several seconds, making typing close to impossible. Of course, my first thought was to blame VirtualBox, since it has a lot to do with the keyboard. I found out some interesting things, like you can send scan-codes directly to virtual-machines with something like
$ VBoxManage controlvm UUID keyboardputscancode aa
(get the UUID via VBoxManage list vms; figuring out scan-codes is left to the reader!). I noticed the problem primarily happening while emacs was in the foreground, meaning I was working on code or an email ... my theory was when I typed too fast some race got hit and put the keyboard into a weird state that a reboot fixed. Well it turns out the problem is almost the exact opposite. Luckily, today I noticed "slow keys enabled" warning that sprung-up and went away quickly just before the keyboard stopped. Once I saw that the game was up; turns out this is a well-known bug that is easily fixed with xkbset -sl. It happens because I was typing too slowly; holding down the shift-key while I thought about something probably. Hopefully this saves someone else a few hours!

15 May 2013

Ian Wienand: Debugging puppetmaster with Foreman

This is a little note for anyone trying to get some debugging out of the puppetmaster when deploying with Foreman. The trick, much as it is, is that Foreman is running puppet via Apache; so if you're trying to start a puppet master daemon outside that it won't be able to bind to port 8140. You thus want to edit the config file Apache is using to launch puppet /etc/puppet/rack/config.ru. It's probably pretty obvious what's happening when you look in there; simply add
ARGV << "--debug"
and you will start to get debugging output. One issue is that this goes to syslog (/var/log/messages) by default and is a lot of output; so much so that it might get throttled. Although you can certainly reconfigure your syslog daemon to split out puppet logs, an easier way is to just skip syslog while you're debugging. Don't be fooled by config options; simply add
ARGV << "--logdest" << "/var/log/puppet/puppet-master.debug"
to the same file to get the logs going to a separate file. Don't forget to restart Apache so the changes stick.

7 February 2013

Ian Wienand: Shared libraries and execute permissions

In the few discussions you can find on the web about shared-libraries and execute-permissions, you can find a range of various opinions but not a lot about what goes when you execute a library. The first thing to consider is how the execute-permission interacts with the dynamic loader. When mapping a library, the dynamic-loader doesn't care about file-permissions; it cares about mapping specific internal parts of the .so. Specifically, it wants to map the PT_LOAD segments as-per the permissions specified by the program-header. A random example:
 $ readelf --segments /usr/lib/x86_64-linux-gnu/libcrypto.so.1.0.0
Elf file type is DYN (Shared object file)
Entry point 0x77c00
There are 7 program headers, starting at offset 64
Program Headers:
  Type           Offset             VirtAddr           PhysAddr
                 FileSiz            MemSiz              Flags  Align
  LOAD           0x0000000000000000 0x0000000000000000 0x0000000000000000
                 0x00000000001b5ea4 0x00000000001b5ea4  R E    200000
  LOAD           0x00000000001b6b60 0x00000000003b6b60 0x00000000003b6b60
                 0x0000000000028dc4 0x000000000002c998  RW     200000
The permissions to load the code and data segments are given the Flags output. Code has execute-permissions, and data has write-permissions. These flags are mapped into flags for the mmap call, which the loader then uses to map the various segments of the file into memory. So, do you actually need execute-permissions on the underlying file to mmap that segment as executable? No, because you can read it. If I can read it, then I can copy the segment to another area of memory I have already mapped with PROT_EXEC and execute it there anyway. Googling suggests that some systems do require execute-permissions on a file if you want to directly mmap pages from it with PROT_EXEC (and if you dig into the kernel source, there's an ancient system call uselib that looks like it comes from a.out days, given it talks about loading libraries at fixed addresses, that also wants this). This doesn't sound like a terrible hardening step; I wouldn't be surprised if some hardening patches require it. Maximum compatability and historical-features such as a.out also probably explains why gcc creates shared libraries with execute permissions by default. Thus, should you feel like it, you can run a shared-library. Something trivial will suffice:
int function(void)  
      return 100;
 
$ gcc -fPIC -shared -o libfoo.so foo.c
$ ./libfoo.so
Segmentation fault
This is a little more interesting (to me anyway) to dig into. At a first pass, why does this even vaguely work? That's easy -- an ELF file is an ELF file, and the kernel is happy to map those PT_LOAD segments in and jump to the entry point for you:
$ readelf --segments ./libfoo.so
Elf file type is DYN (Shared object file)
Entry point 0x570
There are 6 program headers, starting at offset 64
Program Headers:
  Type           Offset             VirtAddr           PhysAddr
                 FileSiz            MemSiz              Flags  Align
  LOAD           0x0000000000000000 0x0000000000000000 0x0000000000000000
                 0x000000000000070c 0x000000000000070c  R E    200000
  LOAD           0x0000000000000710 0x0000000000200710 0x0000000000200710
                 0x0000000000000238 0x0000000000000240  RW     200000
What's interesting here is that the shared-library has an entry point (e_entry) at all. ELF defines it as:
This member gives the virtual address to which the system first transfers control, thus starting the process. If the file has no associated entry point, this member holds zero.
First things first, where did that entry point come from? The ld manual tells us that the linker will set the entry point based upon the following hierarchy:
  • the -e entry command-line option;
  • the ENTRY(symbol) command in a linker script;
  • the value of a target specific symbol
  • the address of the first byte of the .text section, if present;
  • The address 0.
We know we're not specifying an entry point. The ENTRY command is interesting; we can check our default-link script to see if that is specified:
$ ld --verbose   grep ENTRY
ENTRY(_start)
Interesting. Obviously we didn't specify a _start; so do we have one? A bit of digging leads to the crt files, for C Run-Time. These are little object files automatically linked in by gcc that actually do the support-work to get a program to the point that main is ready to run. So, if we go and check out the crt files, one can find a definition of _start in crt1.o
$ nm /usr/lib/x86_64-linux-gnu/crt1.o
crt1.o:
0000000000000000 R _IO_stdin_used
0000000000000000 D __data_start
                 U __libc_csu_fini
                 U __libc_csu_init
                 U __libc_start_main
0000000000000000 T _start
0000000000000000 W data_start
                 U main
But do we have that for our little shared-library? We can get a feel for what gcc is linking in by examining the output of -dumpspecs. Remembering gcc is mostly just a driver that calls out to other things, a specs file is what gcc uses to determine which arguments pass around to various stages of a compile:
$ gcc -dumpspecs
...
*startfile:
% !shared: % pg p profile:gcrt1.o%s;pie:Scrt1.o%s;:crt1.o%s 
 crti.o%s % static:crtbeginT.o%s;shared pie:crtbeginS.o%s;:crtbegin.o%s 
The format isn't really important here (of course you can read about it); but the gist is that various flags, such as -static or -pie get passed different run-time initailisation helpers to link-in. But we can see that if we're creating a shared library we won't be getting crt1.o. We can double-confirm this by checking the output of gcc -v (cut down for clarity).
$ gcc -v -fPIC -shared -o libfoo.so foo.c
Using built-in specs.
 ...
/usr/lib/gcc/x86_64-linux-gnu/4.4.5/collect2 -shared -o libfoo.so
/usr/lib/gcc/x86_64-linux-gnu/4.4.5/../../../../lib/crti.o
/usr/lib/gcc/x86_64-linux-gnu/4.4.5/crtbeginS.o
/tmp/ccRpsQU3.o
/usr/lib/gcc/x86_64-linux-gnu/4.4.5/crtendS.o
/usr/lib/gcc/x86_64-linux-gnu/4.4.5/../../../../lib/crtn.o
So this takes us further down ld's entry-point logic to pointing to the first bytes of .text, which is where the entry-point comes from. So that solves the riddle of the entry point. There's one more weird thing you notice when you run the library, which is the faulting address in kern.log:
libfoo.so[8682]: segfault at 1 ip 0000000000000001 sp 00007fffcd63ec48 error 14 in libfoo.so[7f54c51fa000+1000]
The first thing is decoding error; 14 doesn't seem to have any relation to anything. Of course everyone has the Intel 64 Architecture Manual (or mm/fault.c that also mentions the flags) to decode this into 1110 which means "no page found for a user-mode write access with reserved-bits found to be set" (there's another post in all that someday!). So why did we segfault at 0x1, which is an odd address to turn up? Let's disassemble what actually happens when this starts.
00000000000004a0 <call_gmon_start>:
 4a0:   48 83 ec 08             sub    $0x8,%rsp
 4a4:   48 8b 05 2d 03 20 00    mov    0x20032d(%rip),%rax        # 2007d8 <_DYNAMIC+0x190>
 4ab:   48 85 c0                test   %rax,%rax
 4ae:   74 02                   je     4b2 <call_gmon_start+0x12>
 4b0:   ff d0                   callq  *%rax
 4b2:   48 83 c4 08             add    $0x8,%rsp
 4b6:   c3                      retq
We're moving something in rax and testing it; if true we call that value, otherwise skip and retq. In this case, objdump is getting a bit confused telling us that 2007d8 is related to _DYNAMIC; in fact we can check the relocations to see it's really the value of __gmon_start__:
$ readelf --relocs ./libfoo.so
Relocation section '.rela.dyn' at offset 0x3f0 contains 4 entries:
  Offset          Info           Type           Sym. Value    Sym. Name + Addend
000000200810  000000000008 R_X86_64_RELATIVE                    0000000000200810
0000002007d8  000200000006 R_X86_64_GLOB_DAT 0000000000000000 __gmon_start__ + 0
0000002007e0  000300000006 R_X86_64_GLOB_DAT 0000000000000000 _Jv_RegisterClasses + 0
0000002007e8  000400000006 R_X86_64_GLOB_DAT 0000000000000000 __cxa_finalize + 0
Relocation section '.rela.plt' at offset 0x450 contains 1 entries:
  Offset          Info           Type           Sym. Value    Sym. Name + Addend
000000200808  000400000007 R_X86_64_JUMP_SLO 0000000000000000 __cxa_finalize + 0
Thus call_gmon_start, rather unsurprisingly, checks the value of __gmon_start__ and calls it if it is set. Presumably this is set as part of profiling and called during library initialisation -- but it is clearly not an initialiser by itself. The retq ends up popping a value off the stack and jumping to it, which in this case just happens to be 0x1 -- which we can confirm with gdb by putting a breakpoint on the first text address and examining the stack-pointer:
(gdb) x/2g $rsp
0x7fffffffe7d8:        0x0000000000000000      0x0000000000000001
So that gives us our ultimate failure. Of course, if you're clever, you can get around this and initalise yourself correctly and actually make your shared-library do something when executed. The canonical example of this is libc.so itself:
$ /lib/x86_64-linux-gnu/libc-2.13.so
GNU C Library (Debian EGLIBC 2.13-37) stable release version 2.13, by Roland McGrath et al.
Copyright (C) 2011 Free Software Foundation, Inc.
This is free software; see the source for copying conditions.
...
You can trace through how this actually does work in the same way as we traced through why the trivial example doesn't work. If you wondering my opinion on executable-bits for shared-libraries; I would not give them execute permissions. I can't see it does anything but open the door to confusion. However, understanding exactly why the library segfaults the way it does actually ends up being a fun little tour around various parts of the toolchain!

5 January 2013

Ian Wienand: Position Independent Code and x86-64 libraries

A comment pointed out that the original article from 2008 made a few simplifications that were a bit misleading, so I have taken some time to update this. Thanks for the feedback. If you've ever tried to link non-position independent code into a shared library on x86-64, you should have seen a fairly cryptic error about invalid relocations and missing symbols. Hopefully this will clear it up a little. Let's start with a small program to illustrate.
int global = 100;
int function(int i)  
    return i + global;
 
Firstly, inspect the disassembley of this function:
$gcc -c function.c
$objdump --disassemble function.o
0000000000000000 <function>:
   0:   55                      push   %rbp
   1:   48 89 e5                mov    %rsp,%rbp
   4:   89 7d fc                mov    %edi,-0x4(%rbp)
   7:   8b 05 00 00 00 00       mov    0x0(%rip),%eax        # d <function+0xd>
   d:   03 45 fc                add    -0x4(%rbp),%eax
  10:   c9                      leaveq
  11:   c3                      retq
Lets just go through that for clarity: The IP relative move is really the trick here. We know from the code that it has to move the value of the global variable here. The zero value is simply a place holder - the compiler currently does not determine the required address (i.e. how far away from the instruction pointer the memory holding the global variable is). It leaves behind a relocation -- a note that says to the linker "you should determine the correct address of foo (global in our case), and then patch this bit of the code to point to that addresss". Relocations with addend 
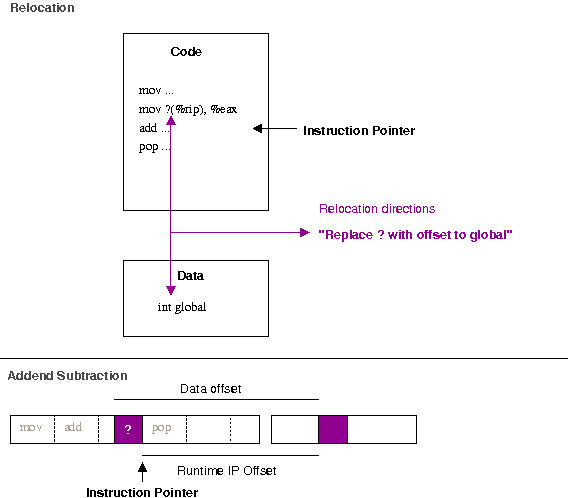
The top portion of the image above gives some idea of how it works. We can examine relocations in binaries with the readelf tool.
$ readelf --relocs ./function.o
Relocation section '.rela.text' at offset 0x518 contains 1 entries:
  Offset          Info           Type           Sym. Value    Sym. Name + Addend
000000000009  000800000002 R_X86_64_PC32     0000000000000000 global + fffffffffffffffc
There are many different types of relocations for different situations; the exact rules for different relocation types are described in the ABI documentation for the architecture. The R_X86_64_PC32 relocation is defined as "the base of the section the symbol is within, plus the symbol value, plus the addend". The addend makes it look more tricky than it is; remember that when an instruction is executing the instruction pointer points to the next instruction to be executed. Therefore, to correctly find the data relative to the instruction pointer, we need to subtract the extra. This can be seen more clearly when layed out in a linear fashion (as in the bottom of the above diagram). If you try and build a shared object (dynamic library) with an object file with this type of relocation, you should get something like:
$ gcc -shared function.c
/usr/bin/ld: /tmp/ccQ2ttcT.o: relocation R_X86_64_32 against  a local symbol' can not be used when making a shared object; recompile with -fPIC
/tmp/ccQ2ttcT.o: could not read symbols: Bad value
collect2: ld returned 1 exit status
If you look back at the disassembly, we notice that the R_X86_64_32 relocation has left only 4-bytes (32-bits) of space left for the relocation entry (the zeros in 7: 8b 15 00 00 00 00). So why does this matter when you're creating a shared library? The first thing to remember is that in a shared library situation, we can not depend on the local value of global actually being the one we want. Consider the following example, where we override the value of global with a LD_PRELOAD library.
$ cat function.c
int global = 100;
int function(int i)  
    return i + global;
 
$ gcc -fPIC -shared -o libfunction.so function.c
$ cat preload.c
int global = 200;
$ gcc -shared preload.c -o libpreload.so
$ cat program.c
#include <stdio.h>
int function(int i);
int main(void)  
   printf("%d\n", function(10));
 
$ gcc -L. -lfunction program.c -o program
$ LD_LIBRARY_PATH=. ./program
110
$ LD_PRELOAD=libpreload.so LD_LIBRARY_PATH=. ./program
210
If the code in libfunction.so were to have a fixed offset into its own data section, it will not be able to be overridden at run-time by the value provided by libpreload.so. Additionally, there are only 4-bytes available to patch in for the address of global -- since a shared library could conceivably be loaded anywhere in the 64-bit (8-byte) address space we therefore need 8-bytes of space to cover ourselves for all possible addresses global might turn up at. The two basic possibilities for an object file are to be either linked into an executable or linked into a shared-library. In the executable case, the value of global will be in the exectuable's data section, which should definitely be reachable with a 32-bit offset of the current instruction-pointer. The instruction-pointer relative address can simply be patched in and the executable is finalised. But what about the shared-library case, where we know the value of global could essentially be anywhere within the 64-bit address space? It is possible to leave 8-bytes of space for the address of global, by telling gcc to use the large-code model. e.g.
$ gcc -c -mcmodel=large function.c
$ objdump --disassemble ./function.o
./function.o:     file format elf64-x86-64
Disassembly of section .text:
0000000000000000 <function>:
   0:  55                      push   %rbp
   1:  48 89 e5                mov    %rsp,%rbp
   4:  89 7d fc                mov    %edi,-0x4(%rbp)
   7:  48 b8 00 00 00 00 00    movabs $0x0,%rax
   e:  00 00 00
  11:  8b 10                   mov    (%rax),%edx
  13:  8b 45 fc                mov    -0x4(%rbp),%eax
  16:  01 d0                   add    %edx,%eax
  18:  5d                      pop    %rbp
  19:  c3                      retq
However, this creates a problem if you really want to share this code. By having to patch in an address of global directly, this means the run-time code above does not remain unchanged. Two separate processes therefore can't share this code -- they each need separate copies that are identical but for their own addresses of global patched into it. By enabling Position Independent Code (PIC, with the flag -fPIC) you can ensure the code remains share-able. PIC means that the output binary does not expect to be loaded at a particular base address, but is happy being put anywhere in memory (compare the output of readelf --segments on a binary such as /bin/ls to that of any shared library). This is obviously critical for implementing lazy-loading (i.e. only loaded when required) shared-libraries, where you may have many libraries loaded in essentially any order at any location. Of course, any problem in computer science can be solved with a layer of abstraction and that is essentially what is done when compiling with -fPIC. To examine this case, let's see what happens with PIC turned on.
$ gcc -fPIC -shared -c  function.c
$ objdump --disassemble ./function.o
./function.o:     file format elf64-x86-64
Disassembly of section .text:
0000000000000000 <function>:
   0:   55                      push   %rbp
   1:   48 89 e5                mov    %rsp,%rbp
   4:   89 7d fc                mov    %edi,-0x4(%rbp)
   7:   48 8b 05 00 00 00 00    mov    0x0(%rip),%rax        # e <function+0xe>
   e:   8b 00                   mov    (%rax),%eax
  10:   03 45 fc                add    -0x4(%rbp),%eax
  13:   c9                      leaveq
  14:   c3                      retq
It's almost the same! We setup the frame pointer with the first two instructions as before. We push the first argument into memory in the pre-allocated "red-zone" as before. Then, however, we do an IP relative load of an address into rax. Next we de-reference this into eax (e.g. eax = *rax in C) before adding the incoming argument to it and returning.
$ readelf --relocs ./function.o
Relocation section '.rela.text' at offset 0x550 contains 1 entries:
  Offset          Info           Type           Sym. Value    Sym. Name + Addend
00000000000a  000800000009 R_X86_64_GOTPCREL 0000000000000000 global + fffffffffffffffc
The magic here is again in the relocations. Notice this time we have a P_X86_64_GOTPCREL relocation. This says "replace the data at offset 0xa with the global offset table (GOT) entry of global. Global Offset Table operation with data variables 
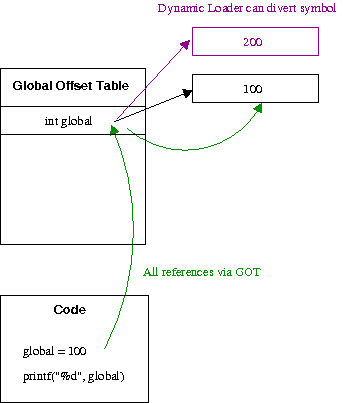
As shown above, the GOT ensures the abstraction required so symbols can be diverted as expected. Each entry is essentially a pointer to the real data (hence the extra dereference in the code above). Since we can assume the GOT is at a fixed offset from the program code within plus or minus 2Gib, the code can use a 32-bit IP relative address to gain access to the table entries. So, taking a look a the final shared-library binary we see a final offset hard-coded
$ gcc -shared -fPIC -o libfunction.so function.c
$ objdump --disassemble ./libfunction.so
00000000000006b0 <function>:
 6b0:  55                      push   %rbp
 6b1:  48 89 e5                mov    %rsp,%rbp
 6b4:  89 7d fc                mov    %edi,-0x4(%rbp)
 6b7:  48 8b 05 8a 02 20 00    mov    0x20028a(%rip),%rax        # 200948 <_DYNAMIC+0x1d8>
 6be:  8b 10                   mov    (%rax),%edx
 6c0:  8b 45 fc                mov    -0x4(%rbp),%eax
 6c3:  01 d0                   add    %edx,%eax
 6c5:  5d                      pop    %rbp
 6c6:  c3                      retq
 6c7:  90                      nop
Every process who wants to share this code just needs to make sure they have their unique address of global at 0x20028a(%rip). Since each process has a separate address-space, this means they can all have different values for global but share the same code! Thus the default of the small-code model is sensible. It is exceedingly rare for an executable to need more than 4-byte offsets for a relative access to a variable in it's data region, so using a full 8-byte value would just be a waste of space. Although leaving 8-bytes would allow access to the variable anywhere in the 64-bit address space; when building a shared library, you really want to use -fPIC to ensure the library can actually be shared, which introduces a different relocation and access to data via the GOT. This should explain why gcc -shared function.c works on x86-32, but does not work on x86-64. Inspecting the code reveals why:
$ objdump --disassemble ./function.o
00000000 <function>:
   0:   55                      push   %ebp
   1:   89 e5                   mov    %esp,%ebp
   3:   a1 00 00 00 00          mov    0x0,%eax
   8:   03 45 08                add    0x8(%ebp),%eax
   b:   5d                      pop    %ebp
   c:   c3                      ret
$ readelf --relocs ./function.o
Relocation section '.rel.text' at offset 0x2ec contains 1 entries:
 Offset     Info    Type            Sym.Value  Sym. Name
00000004  00000701 R_386_32          00000000   global
We start out the same, with the first two instructions setting up the frame pointer. However, next we load a memory value into eax -- as we can see from the relocation information, the address of global. Next we add the incoming argument from the stack (0x8(%ebp)) to the value in this memory location; implicitly dereferencing it. But since we only have a 32-bit address-space, the 4-bytes allocated is enough to access any possible address. So while this can work, you're not creating position-independent code and hence not enabling code-sharing. The disadvantage of PIC code is that you require "bouncing" through the GOT, which requires more loads and reads to find an address than directly referencing it. However, if your program is at the point that this is becoming a performance issue you're probably not reading this blog! Hopefully, this helps clear up that possibly cryptic error message. Further searches around position-independent code, global-offset tables and code-sharing should also yield you more information if it remains unclear.

4 January 2013

Ian Wienand: Tagging handbrake output for iTunes

If you rip your DVD's with a unix-y name like longish-show-name-season-01-01.m4v then the iPad and iPhone video player only shows the prefix of the file-name to it's string limit, so you only ever see longish-show-na and can never tell what episode is what in the overview list. You can edit the files in iTunes to add meta-data information, but that's annoying and non-unix-y. It is of course easy, but I went down several dead-ends with tools that didn't recognise file-extensions, corrupted files and plain didn't work. The package I had most success with is mp4v2-utils and the mp4tags utility. The help is fairly self-explanatory, but something like
mp4tags -show "Show Name" -season <season> -episode <episode> -type "tvshow"  file.m4v
will mean that when you import your file into iTunes it displays correctly as a TV show (and not a movie), is grouped correctly into series and has a name you can see. Unfortunately, it doesn't seem my Nexus 7 tablet picks up these tags. And both players interfaces remain terrible at indicating which episodes have been watched and which have not. But this has allowed me to re-visit my old box-set of Yes Minister which, despite a few odd references to Quango's still seems as relevant as ever!

22 November 2012

Ian Wienand: Upgrading Samsung Series 9 Laptop BIOS without Windows

Having recently acquired a Samsung Series 9 laptop, I'd like to update the BIOS. This is proving rather difficult without Windows. The first thing you download from the Samsung website isn't actually BIOS update at all; it's a Windows application which then goes and finds a BIOS update for your machine. Some time with a Windows VM, tcpdump and you'll end up at http://sbuservice.samsungmobile.com/. I'll leave interested parties to play around at that website, but with a little fiddling you can find the BIOS you're looking for. In this case, it is ITEM_20121024_754_WIN_P08AAH.exe which is the latest version, P08AAH. Unfortunately, this still won't run in any useful way -- in a virtual-machine it errors out saying the battery isn't connected. On previous endeavors such as this, running various incarnations of zip on the .exe file has found interesting components, but not in this case. Not to be deterred, some work with strings will yield the following
$ strings ./ITEM_20121024_754_WIN_P08AAH.exe   grep Copyright
inflate 1.2.7 Copyright 1995-2012 Mark Adler
deflate 1.2.7 Copyright 1995-2012 Jean-loup Gailly and Mark Adler
Now this is interesting, because it tells us that the components aren't using some fancy compression scheme we have no hope of figuring out. Checking RFC1952 we see the following header mentioned
Each member has the following structure:
+---+---+---+---+---+---+---+---+---+---+
 ID1 ID2 CM  FLG      MTIME      XFL OS   (more-->)
+---+---+---+---+---+---+---+---+---+---+
We can easily look for that in the file. Expanding the values, what we're looking for is 0x1f 0x8b 0x08 0x0 0x0 0x0 0x0 0x0 0x0 0x0 which represents the compressed stream (the OS byte is 0xb for NTFS which we can just ignore). A quick hack will get that done and give us the offsets we need
$ ./look-for-headers
Found potential header at 455212
Found potential header at 677136
Found potential header at 1293930
Found potential header at 1294980
Found potential header at 2771193
Found potential header at 2779874
Found potential header at 2789142
Found potential header at 2935778
Found potential header at 3078639
Found potential header at 3083039
Found potential header at 3338552
Found potential header at 3339443
Found potential header at 3352440
Found potential header at 3366757
Found potential header at 3391734
Found potential header at 3444255
Found potential header at 3494372
So, we can feed this into a shell script and extract the streams
FILE=ITEM_20121024_754_WIN_P08AAH.exe
for offset in 455212 677136 1293930 1294980 \
    2771193 2779874 2789142 2935778 3078639 \
    3083039 3338552 3339443 3352440 3366757 \
    3391734 3444255 3494372
do
    echo "create $offset.gz"
    dd if=$FILE  bs=1 skip=$offset   zcat > $offset.data
done
We don't have to worry about the end-point, because zcat will handily stop outputting and ignore junk at the end of the stream. That will yield the following output files:
$ md5sum *
c014e900b02ae39d6e574c63154809b2  1293930.data
982747cd5215c7d51fa1fba255557fef  1294980.data
942c6a8332d5dd06d8f4b2a9cb386ff4  2771193.data
d98d2f80b94f70780b46d1f079a38d93  2779874.data
33ce3174b0e205f58c7cedc61adc6f32  2789142.data
1d6851288f40fa95895b2fadee8a8b82  2935778.data
3a0a9b2fa9b40bdf5721068acde351ce  3078639.data
fc166141d06934e9c7238326f18a4e68  3083039.data
8cf7f86f84afa81363d3cef44b257d50  3338552.data
85e09e18fd495599041e13b4197e1746  3339443.data
0c72004eae0131d52817f23faf8a46a7  3352440.data
26347f93721e7ac49134a17104f56090  3366757.data
26973e301da4948a0016765e40700e8c  3391734.data
c8e4675cda3aa367d523a471bb205fba  3444255.data
7bf5ea753d4cc056b9462a02ac51b160  3494372.data
a2c6562f7f43aaa0e636cc1995b7ee3d  455212.data
d5c91b007dac3a5c6317f8a8833f9304  677136.data
65c0dcd1e7e9f8f87a8e9fb706eb8768  ITEM_20121024_754_WIN_P08AAH.exe
$ file *
1293930.data:                     MS-DOS executable
1294980.data:                     data
2771193.data:                     PE32 executable (native) Intel 80386, for MS Windows
2779874.data:                     PE32+ executable (native) x86-64, for MS Windows
2789142.data:                     PE32 executable (console) Intel 80386 (stripped to external PDB), for MS Windows
2935778.data:                     PE32+ executable (console) x86-64 (stripped to external PDB), for MS Windows
3078639.data:                     MS-DOS executable
3083039.data:                     PE32 executable (GUI) Intel 80386, for MS Windows
3338552.data:                     ASCII text, with CRLF line terminators
3339443.data:                     PE32 executable (native) Intel 80386, for MS Windows
3352440.data:                     PE32+ executable (native) x86-64, for MS Windows
3366757.data:                     PE32 executable (DLL) (GUI) Intel 80386, for MS Windows
3391734.data:                     PE32 executable (GUI) Intel 80386, for MS Windows
3444255.data:                     PE32 executable (GUI) Intel 80386, for MS Windows
3494372.data:                     PE32 executable (DLL) (GUI) Intel 80386, for MS Windows
455212.data:                      PE32 executable (DLL) (console) Intel 80386, for MS Windows
677136.data:                      data
ITEM_20121024_754_WIN_P08AAH.exe: PE32 executable (GUI) Intel 80386, for MS Windows
This is where I get a bit stuck. There is clearly a bunch of WinFlash stuff that Wine kind-of recognises, but so far I haven't managed to figure out how I might go about flashing this from a DOS boot disk. So far I know it's a "Phoenix SecureCore Tiano" based BIOS, and there is some indication that there is a UEFI app to flash the BIOS, but unfortunately I didn't set the laptop up with UEFI (note to anyone setting this up; probably a good idea to do that). I believe that if you have Windows, you can halt the install part-way through and see these files extracted in a temp directory. Possibly if we can put some file-names to the blobs it might help. There may also be a much easier way to do this that I'm completely missing. If anything comes up, I'll update this post; hopefully a future Googlenaut who enjoys BIOS hacking will drop a comment... Update 2012-11-27 I'm unfortunately less optimistic about being able to update this. Certainly the files identified above as MS-DOS executable are EFI binaries; however they are both 32-bit binaries. You can easily get an EFI shell up and running by putting a 64-bit EFI shell binary on a FAT formatted USB disk in the efi/boot/bootx64.efi but it will not run either of those binaries, presumably because they're 32-bit. A 32-bit EFI binary doesn't seem to be recognised for boot, so no luck there. A comment also mentioned some issues with Samsung's and UEFI boot in this bug though it's not clear what models are affected. Another comment mentioned binwalk which also does a nice job of finding the embedded zip streams.
$ strings ./1293930.data
...
RSDS
D:\flash\Source\ENV\src\Efi863\edk\phoenix\edk\Sample\Platform\DUET\ldr16\IA32\oemslp20.pdb
oemslp20.dll
InitializeDriver
2n3u3
$ strings ./3078639.data
en-us;zh-Hans
slp20.marker
slp20.size
slp20.offset
slp20.offset2
read marker fail!
Marker file '%s''s size(%d)!=%d
Not a valided OemMarker!
Update image data error.
marker file is updated.
marker file size too big!
Not a valided OemMarker in ROM.
Update image data error.
SLP marker is reserved.
-PROT
Prot flag is found, mProgFlag is true.
Prot flag is not found, mProgFlag is false.
Please specify input file name.
-PROT
slpFile
OEM Activation 2.0 processing
Failed to Locate Flash Support protocol.
...
D:\flash\Source\ENV\src\Efi863\edk\phoenix\edk\Sample\Platform\DUET\ldr16\IA32\SLP20.pdb

20 October 2012

Ian Wienand: Blog format update

7 years, 8 months, 17 days, 22 hours and 25 minutes ago I wrote the first post for this blog, inspired by a talk by Andrew Tridgell at linux.conf.au 2004 on the value of a personal "junkcode" repository. I know this because I've recently gone through considerable effort to change the format of the blog and keeping the timestamps in sync was one challenge. I've now updated to use Pelican, massaged all the old posts into reStructuredText, done a fair bit of HTML and CSS hacking and hopefully redirected all the old URLs to the correct place. Old comments didn't make the cut, but there wasn't much value there and I'm happy to outsouce to Disqus. How things have changed! As I was writing the CSS to round the corners of some elements, I remembered back to cribbing from Slashdot HTML to do the same thing -- except in those days you used a table with blank elements in each corner with 4 different rounded-corner gif files! Yet I'm still writing in emacs, so some things will forever remain the same I guess.

6 March 2012

Ian Wienand: Investigating the Python bound method

You work with Python for a while and you'll become familiar with printing a method and getting
<bound method Foo.function of <__main__.Foo instance at 0xb736960c>>
I think there is room for one more explanation on the internet, since I've never seen it diagrammed out (maybe for good reason!). An illustration of Python bound methods In the above diagram on the left, we have the fairly simple conceptual model of a class with a function. One naturally tends to think of the function as a part of the class and your instance calls into that function. This is conceptually correct, but a little abstracted from what's actually happening. The right attempts to illustrate the underlying process in some more depth. The first step, on the top right, is building something like the following:
class Foo():
      def function(self):
      	  print "hi!"
As this illustrates, the above code results in two things happening; firstly a function object for function is created and secondly the __dict__ attribute of the class is given a key function that points to this function object. Now the thing about this function object is that it implements the descriptor protocol. In short, if an object implements a __get__ function; then when that object is accessed as an attribute of an object the __get__ function is called. You can read up on the descriptor protocol, but the important part to remember is that it passes in the context from which it is called; that is the object that is calling the function. So, for example, when we then do the following:
f = Foo()
f.function()
what happens is that we get the attribute function of f and then call it. f above doesn't actually know anything about function as such what it does know is its class inheritance and so Python goes searching the parent's class __dict__ to try and find the function attribute. It finds this, and as per the descriptor protocol when the attribute is accessed it calls the __get__ function of the underlying function object. What happens now is that the function's __get__ method returns essentially a wrapper object that stores the information to bind the function to the object. This wrapper object is of type types.MethodType and you can see it stores some important attributes in the object im_func which is the function to call, and im_self which is the object who called it. Passing the object through to im_self is how function gets it's first self argument (the calling object). So when you print the value of f.function() you see it report itself as a bound method. So hopefully this illustrates that a bound method is a just a special object that knows how to call an underlying function with context about the object that's calling it. To try and make this a little more concrete, consider the following program:
import types
class Foo():
    def function(self):
        print "hi!"
f = Foo()
# this is a function object
print Foo.__dict__['function']
# this is a method as returned by
#   Foo.__dict__['function'].__get__()
print f.function
# we can check that this is an instance of MethodType
print type(f.function) == types.MethodType
# the im_func field of the MethodType is the underlying function
print f.function.im_func
print Foo.__dict__['function']
# these are the same object
print f.function.im_self
print f
Running this gives output something like
$ python ./foo.py
<function function at 0xb73540d4>
<bound method Foo.function of <__main__.Foo instance at 0xb736960c>>
True
<function function at 0xb73540d4>
<__main__.Foo instance at 0xb72c060c>
To pull it apart; we can see that Foo.__dict__['function'] is a function object, but then f.function is a bound method. The bound method's im_func is the underlying function object, and the im_self is the object f: thus im_func(im_self) is calling function with the correct object as the first argument self. So the main point is to kind of shift thinking about a function as some particular intrinsic part of a class, but rather as a separate object abstracted from the class that gets bound into an instance as required. The class is in some ways a template and namespacing tool to allow you to find the right function objects; it doesn't actually implement the functions as such. There is plenty more information if you search for "descriptor protocol" and Python binding rules and lots of advanced tricks you can play. But hopefully this is a useful introduction to get an initial handle on what's going on!

8 February 2012

Ian Wienand: Python and --prefix

Something interesting I discovered about Python and --prefix that I can't see a lot of documentation on... When you build Python you can use the standard --prefix flag to configure to home the installation as you require. You might expect that this would hard-code the location to look for the support libraries to the value you gave; however in reality it doesn't quite work like that. Python will only look in the directory specified by prefix after it first searches relative to the path of the executing binary. Specifically, it looks at argv[0] and works through a few steps is argv[0] a symlink? then dereference it. Does argv[0] have any slashes in it? if not, then search the $PATH for the binary. After this, it starts searching for dirname(argv[0])/lib/pythonX.Y/os.py, then dirname(argv[0])/../lib and so on, until it reaches the root. Only after these searches fail does the interpreter then fall back to the hard-coded path specified in the --prefix when configured. What is the practical implications? It means you can move around a python installation tree and have it all "just work", which is nice. In my situation, I noticed this because we have a completely self-encapsulated build toolchain, but we wish to ship the same interpreter on the thing that we're building (during the build, we run the interpreter to create .pyc files for distribution, and we need to be sure that when we did this we didn't accidentally pick up any of the build hosts python; only the toolchain python). The PYTHONHOME environment variable does override this behaviour; if it is set then the search stops there. Another interesting thing is that sys.prefix is therefore not the value passed in by --prefix during configure, but the value of the current dynamically determined prefix value. If you run an strace, you can see this in operation.
readlink("/usr/bin/python", "python2.7", 4096) = 9
readlink("/usr/bin/python2.7", 0xbf8b014c, 4096) = -1 EINVAL (Invalid argument)
stat64("/usr/bin/Modules/Setup", 0xbf8af0a0) = -1 ENOENT (No such file or directory)
stat64("/usr/bin/lib/python2.7/os.py", 0xbf8af090) = -1 ENOENT (No such file or directory)
stat64("/usr/bin/lib/python2.7/os.pyc", 0xbf8af090) = -1 ENOENT (No such file or directory)
stat64("/usr/lib/python2.7/os.py",  st_mode=S_IFREG 0644, st_size=26300, ... ) = 0
stat64("/usr/bin/Modules/Setup", 0xbf8af0a0) = -1 ENOENT (No such file or directory)
stat64("/usr/bin/lib/python2.7/lib-dynload", 0xbf8af0a0) = -1 ENOENT (No such file or directory)
stat64("/usr/lib/python2.7/lib-dynload",  st_mode=S_IFDIR 0755, st_size=4096, ... ) = 0
Firstly it dereferences symlinks. Then it looks for Modules/Setup to see if it is running out of the build tree. Then it starts looking for os.py, walking its way upwards. One interesting thing that may either be a bug or a feature, I haven't decided, is that if you set the prefix to / then the interpreter will not go back to the root and then look in /lib. This is probably pretty obscure usage though! All this is implemented in Modules/getpath.c which has a nice big comment at the top explaining the rules in detail.

26 January 2012

Ian Wienand: pylint and hiding of attributes

I recently came across the pylint error:
E:  3,4:Foo.foo: An attribute affected in foo line 12 hide this method
in code that boiled down to essentially:
class Foo:
    def foo(self):
        return True
    def foo_override(self):
        return False
    def __init__(self, override=False):
        if override:
            self.foo = self.foo_override
Unfortunately that message isn't particularly helpful in figuring out what's going on. I still can't claim to be 100% sure what the message is intended to convey, but I can construct something that maybe it's talking about. Consider the following using the above class
foo = Foo()
moo = Foo(override=True)
print "expect True  : %s" % foo.foo()
print "expect False : %s" % moo.foo()
print "expect True  : %s" % Foo.foo(foo)
print "expect False : %s" % Foo.foo(moo)
which gives output of:
$ python ./foo.py 
expect True  : True
expect False : False
expect True  : True
expect False : True
Now, if you read just about any Python tutorial, it will say something along the lines of:
... the special thing about methods is that the object is passed as the first argument of the function. In our example, the call x.f() is exactly equivalent to MyClass.f(x). In general, calling a method with a list of n arguments is equivalent to calling the corresponding function with an argument list that is created by inserting the method s object before the first argument. [Official Python Tutorial]
The official tutorial above is careful to say in general; others often don't. The important point to remember is how python internally resolves attribute references as described by the data model. The moo.foo() call is really moo.__dict__["foo"](moo); examining the __dict__ for the moo object we can see that foo has been re-assigned:
>>> print moo.__dict__
 'foo': <bound method Foo.foo_override of <__main__.Foo instance at 0xb72838ac>> 
Our Foo.foo(moo) call is really Foo.__dict__["foo"](moo) -- the fact that we reassigned foo in moo is never noticed. If we were to do something like Foo.foo = Foo.foo_override we would modify the class __dict__, but that doesn't give us the original semantics. So I postulate that the main point of this warning is to suggest to you that you're creating an instance that now behaves differently to its class. Because the symmetry of calling an instance and calling a class is well understood you might end up getting some strange behaviour, especially if you start with heavy-duty introspection of classes. Thinking about various hacks and ways to re-write this construct is kind of interesting. I think I might have found a hook for a decent interview question :)

21 September 2011

Ian Wienand: Exploring $ORIGIN

Anyone who works with building something with a few libraries will quickly become familiar with rpath's; that is the ability to store a path inside a binary for finding dependencies at runtime. Slightly less well known is that the dynamic linker provides some options for this path specification; one in particular is a path with the special variable $ORIGIN. ld.so man page has the following to say about the an $ORIGIN appearing in the rpath:
  ld.so understands the string $ORIGIN (or equivalently $ ORIGIN )
  in  an  rpath specification to mean the directory containing the
  application  executable.  Thus,  an   application   located   in
  somedir/app   could   be  compiled  with  gcc  -Wl,-rpath,'$ORI 
  GIN/../lib' so that it finds an  associated  shared  library  in
  somedir/lib  no matter where somedir is located in the directory
  hierarchy.
  
As a way of a small example, consider the following:
$ cat Makefile
main: main.c lib/libfoo.so
	gcc -g -Wall -o main -Wl,-rpath='$$ORIGIN/lib' -L ./lib -lfoo main.c
lib/libfoo.so: lib/foo.c
	gcc -g -Wall -fPIC -shared -o lib/libfoo.so lib/foo.c
$ cat main.c
void function(void);
int main(void)
 
   function();
   return 0;
 
$ cat lib/foo.c
#include <stdio.h>
void function(void)
 
   printf("called!\n");
 
$ make
gcc -g -Wall -fPIC -shared -o lib/libfoo.so lib/foo.c
gcc -g -Wall -o main -Wl,-rpath='$ORIGIN/lib' -L ./lib -lfoo main.c
$ ./main
called!
Now, wherever you should choose to locate main, as long as the library is in the right relative location it will be found correctly. If you are wondering how this works, examining the back-trace from the linker function that expands it is helpful:
$ gdb ./main
(gdb) break _dl_get_origin
Function "_dl_get_origin" not defined.
Make breakpoint pending on future shared library load? (y or [n]) y
Breakpoint 1 (_dl_get_origin) pending.
(gdb) r
Starting program: /tmp/test-origin/main 
Breakpoint 1, _dl_get_origin () at ../sysdeps/unix/sysv/linux/dl-origin.c:37
37	../sysdeps/unix/sysv/linux/dl-origin.c: No such file or directory.
	in ../sysdeps/unix/sysv/linux/dl-origin.c
(gdb) bt
#0  _dl_get_origin () at ../sysdeps/unix/sysv/linux/dl-origin.c:37
#1  0x00007ffff7de61f4 in expand_dynamic_string_token (l=0x7ffff7ffe128, 
    s=<value optimized out>) at dl-load.c:331
#2  0x00007ffff7de62ea in decompose_rpath (sps=0x7ffff7ffe440, 
    rpath=0xffffffc0 <Address 0xffffffc0 out of bounds>, l=0x0, 
    what=0x7ffff7df780a "RPATH") at dl-load.c:554
#3  0x00007ffff7de7051 in _dl_init_paths (llp=0x0) at dl-load.c:722
#4  0x00007ffff7de2124 in dl_main (phdr=0x7ffff7ffe6b8, 
    phnum=<value optimized out>, user_entry=0x7ffff7ffeb28) at rtld.c:1391
#5  0x00007ffff7df3647 in _dl_sysdep_start (
    start_argptr=<value optimized out>, dl_main=0x7ffff7de14e0 <dl_main>)
    at ../elf/dl-sysdep.c:243
#6  0x00007ffff7de0423 in _dl_start_final (arg=0x7fffffffe7c0) at rtld.c:338
#7  _dl_start (arg=0x7fffffffe7c0) at rtld.c:564
#8  0x00007ffff7ddfaf8 in _start () from /lib64/ld-linux-x86-64.so.2
Just from a first look we can divine that this has found the RPATH header in the dynamic section and has decided to expand the string $ORIGIN.
$ readelf --dynamic ./main
Dynamic section at offset 0x7d8 contains 23 entries:
  Tag        Type                         Name/Value
 0x0000000000000001 (NEEDED)             Shared library: [libfoo.so]
 0x0000000000000001 (NEEDED)             Shared library: [libc.so.6]
 0x000000000000000f (RPATH)              Library rpath: [$ORIGIN/lib]
 0x000000000000000c (INIT)               0x4004d8
 0x000000000000000d (FINI)               0x4006f8
At this point it proceeds to do a readlink on /proc/self/exe to get the path to the currently running binary, effectively does a basename on it and replaces the value of $ORIGIN. Interestingly, if this should fail, it will fall back on the environment variable LD_ORIGIN_PATH for unknown reasons. This might be useful if you were in a bad situation where /proc was not mounted and you still had to run your binary, although you could probably achieve the same thing via the use of LD_LIBRARY_PATH just as well. This feature should be used with some caution to avoid turning your application in a mess that can't be packaged in any standard manner. One common example of use is probably your java virtual machine to find its implementation libraries.
$ readelf --dynamic /usr/lib/jvm/java-6-sun/bin/java
Dynamic section at offset 0x9a28 contains 25 entries:
  Tag        Type                         Name/Value
 0x0000000000000001 (NEEDED)             Shared library: [libpthread.so.0]
 0x0000000000000001 (NEEDED)             Shared library: [libjli.so]
 0x0000000000000001 (NEEDED)             Shared library: [libdl.so.2]
 0x0000000000000001 (NEEDED)             Shared library: [libc.so.6]
 0x000000000000000e (SONAME)             Library soname: [lib.so]
 0x000000000000000f (RPATH)              Library rpath: [$ORIGIN/../lib/amd64/jli:$ORIGIN/../jre/lib/amd64/jli]
 ...
There is a small but interesting security issue. If an attacker can hardlink to your binary that is using $ORIGIN then any path expansion is now relative to the attackers directory. Hence it is possible to make the linker read in arbitrary libraries and hence run arbitrary code. Clearly if your program is running setuid as someone else, such as root, you've just given up the keys to the house! Luckily, the dynamic linker will not let you shoot yourself in the foot like this, and prevents expansion of the $ORIGIN field if the program is running setuid.
$ sudo chown root ./main
$ sudo chmod +s ./main
$ ./main
./main: error while loading shared libraries: libfoo.so: cannot open shared object file: No such file or directory
However, this is a good example of why you might want to keep users home and temp directories on separate file systems away from where binaries live. There is also a similar variable $PLATFORM, which describes the current running system. This is gained via the auxiliary vector, which I have written about here and here. Setting LD_SHOW_AUXV=1 will allow you to examine this value.
$ LD_SHOW_AUXV=1 ls
...
AT_PLATFORM:     x86_64
...

28 July 2011

Ian Wienand: The quickest way to do nothing

As I was debugging something recently, an instruction popped up that seemed a little incongruous:
lea 0x0(%edi,%eiz,1),%edi
Now this is an interesting instruction on a few levels. Firstly, %eiz is a psuedo-register that simply equates to zero somewhat like MIPS r0; I don't think it is really in common usage. But when you look closer, this instruction is a fancy way of doing nothing. It's a little clearer in Intel syntax mode:
lea    edi,[edi+eiz*1+0x0]
So we can see that this is using scaled indexed addressing mode to load into %edi the value in %edi plus 0 * 1 with an offset of 0x0; i.e. put the value of %edi into %edi, i.e. do nothing. So why would this appear? What we can see from the disassembley is that this single instruction takes up an impressive 7 bytes:
8048489:	8d bc 27 00 00 00 00	lea    edi,[edi+eiz*1+0x0]
Now, compare that to a standard nop which requires just a single byte to encode. Thus to pad out 7 bytes of space would require 7 nop instructions to be issued, which is a significantly slower way of doing nothing! Let's investigate just how much... Below is a simple program that does nothing in a tight-loop; firstly using nops and then the lea do-nothing method.
#include <stdio.h>
#include <stdint.h>
#include <time.h>
typedef uint64_t cycle_t;
static inline cycle_t
i386_get_cycles(void)
 
        cycle_t result;
        __asm__ __volatile__("rdtsc" : "=A" (result));
        return result;
 
#define get_cycles i386_get_cycles
int main()  
	int i;
	uint64_t t1, t2;
	t1 = get_cycles();
	/* nop do nothing */
	while (i < 100000)  
		__asm__ __volatile__("nop;nop;nop");
		i++;
	 
	t2 = get_cycles();
	printf("%ld\n", t2 - t1);
	i = 0;
	t1 = get_cycles();
	/* lea do-nothing */
	while (i < 100000)  
		__asm__ __volatile__("lea 0x0(%edi,%eiz,1),%edi");
		i++;
	 
	t2 = get_cycles();
	printf("%ld\n", t2 - t1);
 
Firstly, you'll notice that rather than the 7-bytes mentioned before, we're comparing 3-byte sequences. That's because the lea instruction ends up encoded as:
 8048388:       8d 3c 27                lea    (%edi,%eiz,1),%edi
When you hand-code this instruction, you can't actually convince the assembler to pad out those extra zeros for the zero displacement because it realises it doesn't need them, so why would it waste the space! So, how did they get in there in the original disassembley? If gas is trying to align something by padding, it has built-in sequences for the most efficient way of doing that for different sizes (you can see it in i386_align_code of gas/config/tc-i386.c which adds the extra 4 bytes in directly). Anyway, we can build and test this out (note you need the special -mindex-reg flag passed to gas to use the %eiz syntax):
$ gcc -O3 -Wa,-mindex-reg  -o wait wait.c
$ ./wait
300072
189945
So, if you need 3-bytes of padding in your code for some reason, it's ~160% slower to pad out 3-bytes with no-ops rather than a single larger instruction (at least on my aging Pentium M laptop). So now you can rest easy knowing that even though your code is doing nothing, it is doing it in the most efficient manner possible!

1 July 2011

Ian Wienand: Debugging __thead variables from coredumps

I think the old-fashioned coredump is a little under-appreciated these days. I'm not sure when it changed, but I even had to add myself to /etc/security/limits.conf to raise my ulimit to even create one. Anyway, debugging __thread variables from coredumps is a bit of a pain. For the uninitiated, the __thread identifier specifies a thread-local variable, i.e. every thread gets its own copy of the variable automatically. The implementation of this is highly architecture specific. The reason is that TLS entries need to be accessed via a register kept as part of the thread state, and thus every architecture chooses their own register and builds their own ABI. On x86-32, which is very register-limited, you certainly don't want to dedicate a register to a pointer to TLS variables and take it out of operation. Luckily there is the hang-over from the 70's (60's? 50's?) segmentation. Without going into real detail, segment registers can be used to offset into a region of memory based on a look-up of a region descriptor stored in a table. Simple example of gs and the GDT Above, you see a simplified example of the %gs register loaded with the index value 2, and thus when you access %gs:20 what you are saying is "find entry 2 in the global descriptor table (GDT), follow it and offset 20 into that region. The kernel gives each thread its own GDT (i.e. the GDT register is part of the thread-state). Thus __thread variables are stored based on segment offsets and voila thread-local storage. Now, there's a few tricks here. For various reasons, a process can not setup entries in the GDT; this is a privileged operation that must be done by the kernel. There is actually a special system call for threads to setup their TLS areas in the GDT set_thread_area. When a new thread starts, the thread-library and dynamic linker conspire to allocate and load any static TLS data (i.e. if you have a global __thread variable initialised to some value, then every thread must see that value when it starts) and then calls this to make sure the variables are ready to go. After that, the gs register is filled with the index of that GDT entry, and all TLS access goes via it. That, in a nut-shell, is TLS for x86-32. Now, to the problem. Take, for example, the following short program:
#include <stdio.h>
#include <stdlib.h>
#include <unistd.h>
#include <pthread.h>
int __thread foo;
void* thread(void *in)  
        foo = (int)in;
        printf("foo is %d\n", foo);
        while (1)  
                sleep(10);
         
 
int main(void)  
        pthread_t threads[5];
        int i;
        for (i=0; i<5; i++)  
                pthread_create(&threads[i], NULL,
                               thread, (void*)i);
         
        sleep(5);
        abort();
 
We start a few threads and then abort to make it dump core. But, if you try and examine foo:
$ gdb ./thread core 
GNU gdb (GDB) 7.2-debian
Reading symbols from /home/ianw/tmp/thread/thread...done.
[New Thread 4970]
[New Thread 4975]
[New Thread 4974]
[New Thread 4973]
[New Thread 4972]
[New Thread 4971]
Core was generated by  ./thread'.
Program terminated with signal 6, Aborted.
#0  0xffffe424 in __kernel_vsyscall ()
(gdb) print foo
Cannot find thread-local variables on this target
It seems that gdb doesn't know how to find the value of foo because its not a variable in the usual sense ("this target", in this case, means a coredump). It relies on accessing via the gs register, which relies on the current processes' GDT state, which has since been destroyed. If you care to consult the canonical source of TLS info, you can find out exactly why this is so hard to figure out generically. However, with some work, we can start to figure out the value by hand. A coredump is really a ELF file full of just two things: a bunch of LOAD segments that are just dumps of the process memory regions, and a NOTE section that includes a bunch of notes that the kernel dumps out for us such as the current register state, the process id, the signal that killed us, etc. Here's an example of a core file under readelf
$ readelf --headers ./core 
ELF Header:
  Magic:   7f 45 4c 46 01 01 01 00 00 00 00 00 00 00 00 00 
  Class:                             ELF32
...
  OS/ABI:                            UNIX - System V
...
  Type:                              CORE (Core file)
...
There are no sections in this file.
Program Headers:
  Type           Offset   VirtAddr   PhysAddr   FileSiz MemSiz  Flg Align
  NOTE           0x0003d4 0x00000000 0x00000000 0x006b4 0x00000     0
  LOAD           0x001000 0x08048000 0x00000000 0x00000 0x01000 R E 0x1000
  LOAD           0x001000 0x08049000 0x00000000 0x01000 0x01000 RW  0x1000
  LOAD           0x002000 0x0804a000 0x00000000 0x21000 0x21000 RW  0x1000
  LOAD           0x023000 0x46015000 0x00000000 0x00000 0x1b000 R E 0x1000
  LOAD           0x023000 0x46030000 0x00000000 0x01000 0x01000 R   0x1000
  LOAD           0x024000 0x46031000 0x00000000 0x01000 0x01000 RW  0x1000
...
You can examine the notes; with readelf we see:
$ readelf --notes ./core 
Notes at offset 0x000003d4 with length 0x000006b4:
  Owner                 Data size      Description
  CORE                 0x00000090      NT_PRSTATUS (prstatus structure)
  CORE                 0x0000007c      NT_PRPSINFO (prpsinfo structure)
  CORE                 0x000000a0      NT_AUXV (auxiliary vector)      
  LINUX                0x00000030      Unknown note type: (0x00000200) 
  CORE                 0x00000090      NT_PRSTATUS (prstatus structure)
  LINUX                0x00000030      Unknown note type: (0x00000200) 
  CORE                 0x00000090      NT_PRSTATUS (prstatus structure)
  LINUX                0x00000030      Unknown note type: (0x00000200) 
  CORE                 0x00000090      NT_PRSTATUS (prstatus structure)
  LINUX                0x00000030      Unknown note type: (0x00000200)
  CORE                 0x00000090      NT_PRSTATUS (prstatus structure)
  LINUX                0x00000030      Unknown note type: (0x00000200)
  CORE                 0x00000090      NT_PRSTATUS (prstatus structure)
  LINUX                0x00000030      Unknown note type: (0x00000200)
This shows 5 notes of type NT_PRSTATUS; it should be little surprise that each of these notes describes the process status of one running thread. When gdb pops up [New Thread 4973] that's because it just hit another note that describes the new thread. To actually make sense of the note, however, we need some other tools that look deeper. The elfutils based tools give us a better description of the various notes in the coredump; more akin to what GDB is interpreting them as. Below I've extracted one thread's info:
$ eu-readelf --notes core
...
  CORE                 144  PRSTATUS
    info.si_signo: 6, info.si_code: 0, info.si_errno: 0, cursig: 6
    sigpend: <>
    sighold: <>
    pid: 4970, ppid: 4960, pgrp: 4970, sid: 4960
    utime: 0.000000, stime: 0.000000, cutime: 0.000000, cstime: 0.000000
    orig_eax: 270, fpvalid: 0
    ebx:           4970  ecx:           4970  edx:              6
    esi:              0  edi:     1176018932  ebp:     0xbfa5b710
    eax:              0  eip:     0xffffe424  eflags:  0x00000206
    esp:     0xbfa5b6f8
    ds: 0x007b  es: 0x007b  fs: 0x0000  gs: 0x0033  cs: 0x0073  ss: 0x007b
  LINUX                 48  386_TLS
    index: 6, base: 0xb6043b70, limit: 0x000fffff, flags: 0x00000051
    index: 7, base: 0x00000000, limit: 0x00000000, flags: 0x00000028
    index: 8, base: 0x00000000, limit: 0x00000000, flags: 0x00000028
What's particularly interesting here is that the note type that was previously unknown (Unknown note type: (0x00000200)) has been resolved for us it is in fact of type NT_386_TLS and is a dump of the GDT entries for the thread. So, if we examine how our function is accessing our TLS variable by disassembling the thread function:
(gdb) disassemble thread
Dump of assembler code for function thread:
   0x08048514 <+0>:    push   %ebp
   0x08048515 <+1>:    mov    %esp,%ebp
   0x08048517 <+3>:    sub    $0x18,%esp
   0x0804851a <+6>:    mov    0x8(%ebp),%eax
   0x0804851d <+9>:    mov    %eax,%gs:0xfffffffc
   0x08048523 <+15>:   mov    %gs:0xfffffffc,%edx
   0x0804852a <+22>:   mov    $0x8048670,%eax
   0x0804852f <+27>:   mov    %edx,0x4(%esp)
   0x08048533 <+31>:   mov    %eax,(%esp)
   0x08048536 <+34>:   call   0x80483f4 <printf@plt>
   0x0804853b <+39>:   movl   $0xa,(%esp)
   0x08048542 <+46>:   call   0x8048404 <sleep@plt>
   0x08048547 <+51>:   jmp    0x804853b <thread+39>
Examining the disassembly we can see that foo is accessed via an offset of -4 from %gs (this is OK, as our limit value is maxed out. See the TLS ABI doc for more info). Now, we can examine gs and see which selector it is telling us to use:
(gdb) print $gs >> 3
$31 = 6
Above we shift out the last 3 bits, as these refer to the privilege level (bits 0 and 1) and if this is a GDT or LDT reference (bit 2). Thus, looking at the GDT descriptor for index 6:
  LINUX                 48  386_TLS
    index: 6, base: 0xb6043b70, limit: 0x000fffff, flags: 0x00000051
we can finally do some maths from the base-address to figure out the value:
(gdb) print *(int*)(0xb6043b70 - 4)
$34 = 3
Thus we have found our TLS value; in this case for thread 3 the value is indeed 3. I caution this is the simplest possible case; other "models" (see the TLS doc, again) may not be so simple to work out by hand, but this would certainly be how you would start.

10 May 2011

Ian Wienand: PLT and GOT - the key to code sharing and dynamic libraries

(this post was going to be about something else, but after getting this far, I think it stands on its own as an introduction to dynamic linking) The shared library is an integral part of a modern system, but often the mechanisms behind the implementation are less well understood. There are, of course, many guides to this sort of thing. Hopefully this adds another perspective that resonates with someone. Let's start at the beginning - relocations are entries in binaries that are left to be filled in later -- at link time by the toolchain linker or at runtime by the dynamic linker. A relocation in a binary is a descriptor which essentially says "determine the value of X, and put that value into the binary at offset Y" each relocation has a specific type, defined in the ABI documentation, which describes exactly how "determine the value of" is actually determined. Here's the simplest example:
$ cat a.c
extern int foo;
int function(void)  
    return foo;
 
$ gcc -c a.c 
$ readelf --relocs ./a.o  
Relocation section '.rel.text' at offset 0x2dc contains 1 entries:
 Offset     Info    Type            Sym.Value  Sym. Name
00000004  00000801 R_386_32          00000000   foo
The value of foo is not known at the time you make a.o, so the compiler leaves behind a relocation (of type R_386_32) which is saying "in the final binary, patch the value at offset 0x4 in this object file with the address of symbol foo". If you take a look at the output, you can see at offset 0x4 there are 4-bytes of zeros just waiting for a real address:
$ objdump --disassemble ./a.o
./a.o:     file format elf32-i386
Disassembly of section .text:
00000000 <function>:
   0:	 55			push   %ebp
   1:	 89 e5                	mov    %esp,%ebp
   3:	 a1 00 00 00 00       	mov    0x0,%eax
   8:	 5d                   	pop    %ebp
   9:	 c3                   	ret    
That's link time; if you build another object file with a value of foo and build that into a final executable, the relocation can go away. But there is a whole bunch of stuff for a fully linked executable or shared-library that just can't be resolved until runtime. The major reason, as I shall try to explain, is position-independent code (PIC). When you look at an executable file, you'll notice it has a fixed load address
$ readelf --headers /bin/ls
[...]
ELF Header:
[...]
  Entry point address:               0x8049bb0
Program Headers:
  Type           Offset   VirtAddr   PhysAddr   FileSiz MemSiz  Flg Align
[...]
  LOAD           0x000000 0x08048000 0x08048000 0x16f88 0x16f88 R E 0x1000
  LOAD           0x016f88 0x0805ff88 0x0805ff88 0x01543 0x01543 RW  0x1000
This is not position-independent. The code section (with permissions R E; i.e. read and execute) must be loaded at virtual address 0x08048000, and the data section (RW) must be loaded above that at exactly 0x0805ff88. This is fine for an executable, because each time you start a new process (fork and exec) you have your own fresh address space. Thus it is a considerable time saving to pre-calculate addresses from and have them fixed in the final output (you can make position-independent executables, but that's another story). This is not fine for a shared library (.so). The whole point of a shared library is that applications pick-and-choose random permutations of libraries to achieve what they want. If your shared library is built to only work when loaded at one particular address everything may be fine until another library comes along that was built also using that address. The problem is actually somewhat tractable you can just enumerate every single shared library on the system and assign them all unique address ranges, ensuring that whatever combinations of library are loaded they never overlap. This is essentially what prelinking does (although that is a hint, rather than a fixed, required address base). Apart from being a maintenance nightmare, with 32-bit systems you rapidly start to run out of address-space if you try to give every possible library a unique location. Thus when you examine a shared library, they do not specify a particular base address to be loaded at:
$ readelf --headers /lib/libc.so.6
Program Headers:
  Type           Offset   VirtAddr   PhysAddr   FileSiz MemSiz  Flg Align
[...]
  LOAD           0x000000 0x00000000 0x00000000 0x236ac 0x236ac R E 0x1000
  LOAD           0x023edc 0x00024edc 0x00024edc 0x0015c 0x001a4 RW  0x1000
Shared libraries also have a second goal code sharing. If a hundred processes use a shared library, it makes no sense to have 100 copies of the code in memory taking up space. If the code is completely read-only, and hence never, ever, modified, then every process can share the same code. However, we have the constraint that the shared library must still have a unqiue data instance in each process. While it would be possible to put the library data anywhere we want at runtime, this would require leaving behind relocations to patch the code and inform it where to actually find the data destroying the always read-only property of the code and thus sharability. As you can see from the above headers, the solution is that the read-write data section is always put at a known offset from the code section of the library. This way, via the magic of virtual-memory, every process sees its own data section but can share the unmodified code. All that is needed to access data is some simple maths; address of thing I want = my current address + known fixed offset. Well, simple maths is all relative! "My current address" may or may not be easy to find. Consider the following:
$ cat test.c
static int foo = 100;
int function(void)  
    return foo;
 
$ gcc -fPIC -shared -o libtest.so test.c
So foo will be in data, at a fixed offset from the code in function, and all we need to do is find it! On amd64, this is quite easy, check the disassembly:
000000000000056c <function>:
 56c:		 55			push   %rbp
 56d:		 48 89 e5             	mov    %rsp,%rbp
 570:		 8b 05 b2 02 20 00    	mov    0x2002b2(%rip),%eax        # 200828 <foo>
 576:		 5d                   	pop    %rbp
This says "put the value at offset 0x2002b2 from the current instruction pointer (%rip) into %eax. That's it we know the data is at that fixed offset so we're done. i386, on the other hand, doesn't have the ability to offset from the current instruction pointer. Some trickery is required there:
0000040c <function>:
 40c:	 55			push   %ebp
 40d:	 89 e5                	mov    %esp,%ebp
 40f:	 e8 0e 00 00 00       	call   422 <__i686.get_pc_thunk.cx>
 414:	 81 c1 5c 11 00 00    	add    $0x115c,%ecx
 41a:	 8b 81 18 00 00 00    	mov    0x18(%ecx),%eax
 420:	 5d                   	pop    %ebp
 421:	 c3                   	ret    
00000422 <__i686.get_pc_thunk.cx>:
 422:	 8b 0c 24		mov    (%esp),%ecx
 425:	 c3                   	ret    
The magic here is __i686.get_pc_thunk.cx. The architecture does not let us get the current instruction address, but we can get a known fixed address the value __i686.get_pc_thunk.cx pushes into cx is the return value from the call, i.e in this case 0x414. Then we can do the maths for the add instruction; 0x115c + 0x414 = 0x1570, the final move goes 0x18 bytes past that to 0x1588 ... checking the disassembly
00001588 <global>:
    1588:       64 00 00                add    %al,%fs:(%eax)
i.e., the value 100 in decimal, stored in the data section. We are getting closer, but there are still some issues to deal with. If a shared library can be loaded at any address, then how does an executable, or other shared library, know how to access data or call functions in it? We could, theoretically, load the library and patch up any data references or calls into that library; however as just described this would destroy code-sharability. As we know, all problems can be solved with a layer of indirection, in this case called global offset table or GOT. Consider the following library:
$ cat test.c
extern int foo;
int function(void)  
    return foo;
 
$ gcc -shared -fPIC -o libtest.so test.c
Note this looks exactly like before, but in this case the foo is extern; presumably provided by some other library. Let's take a closer look at how this works, on amd64:
$ objdump --disassemble libtest.so
[...]
00000000000005ac <function>:
 5ac:		 55			push   %rbp
 5ad:		 48 89 e5             	mov    %rsp,%rbp
 5b0:		 48 8b 05 71 02 20 00 	mov    0x200271(%rip),%rax        # 200828 <_DYNAMIC+0x1a0>
 5b7:		 8b 00                	mov    (%rax),%eax
 5b9:		 5d                   	pop    %rbp
 5ba:		 c3                   	retq   
$ readelf --sections libtest.so
Section Headers:
  [Nr] Name              Type             Address           Offset
       Size              EntSize          Flags  Link  Info  Align
[...]
  [20] .got              PROGBITS         0000000000200818  00000818
       0000000000000020  0000000000000008  WA       0     0     8
$ readelf --relocs libtest.so
Relocation section '.rela.dyn' at offset 0x418 contains 5 entries:
  Offset          Info           Type           Sym. Value    Sym. Name + Addend
[...]
000000200828  000400000006 R_X86_64_GLOB_DAT 0000000000000000 foo + 0
The disassembly shows that the value to be returned is loaded from an offset of 0x200271 from the current %rip; i.e. 0x0200828. Looking at the section headers, we see that this is part of the .got section. When we examine the relocations, we see a R_X86_64_GLOB_DAT relocation that says "find the value of symbol foo and put it into address 0x200828. So, when this library is loaded, the dynamic loader will examine the relocation, go and find the value of foo and patch the .got entry as required. When it comes time for the code loads to load that value, it will point to the right place and everything just works; without having to modify any code values and thus destroy code sharability. This handles data, but what about function calls? The indirection used here is called a procedure linkage table or PLT. Code does not call an external function directly, but only via a PLT stub. Let's examine this:
$ cat test.c
int foo(void);
int function(void)  
    return foo();
 
$ gcc -shared -fPIC -o libtest.so test.c
$ objdump --disassemble libtest.so
[...]
00000000000005bc <function>:
 5bc:		 55			push   %rbp
 5bd:		 48 89 e5             	mov    %rsp,%rbp
 5c0:		 e8 0b ff ff ff       	callq  4d0 <foo@plt>
 5c5:		 5d                   	pop    %rbp
$ objdump --disassemble-all libtest.so
00000000000004d0 <foo@plt>:
 4d0:   ff 25 82 03 20 00       jmpq   *0x200382(%rip)        # 200858 <_GLOBAL_OFFSET_TABLE_+0x18>
 4d6:   68 00 00 00 00          pushq  $0x0
 4db:   e9 e0 ff ff ff          jmpq   4c0 <_init+0x18>
$ readelf --relocs libtest.so
Relocation section '.rela.plt' at offset 0x478 contains 2 entries:
  Offset          Info           Type           Sym. Value    Sym. Name + Addend
000000200858  000400000007 R_X86_64_JUMP_SLO 0000000000000000 foo + 0
So, we see that function makes a call to code at 0x4d0. Disassembling this, we see an interesting call, we jump to the value stored in 0x200382 past the current %rip (i.e. 0x200858), which we can then see the relocation for the symbol foo. It is interesting to keep following this through; let's look at the initial value that is jumped to:
$ objdump --disassemble-all libtest.so
Disassembly of section .got.plt:
0000000000200840 <.got.plt>:
  200840:       98                      cwtl   
  200841:       06                      (bad)  
  200842:       20 00                   and    %al,(%rax)
        ...
  200858:       d6                      (bad)  
  200859:       04 00                   add    $0x0,%al
  20085b:       00 00                   add    %al,(%rax)
  20085d:       00 00                   add    %al,(%rax)
  20085f:       00 e6                   add    %ah,%dh
  200861:       04 00                   add    $0x0,%al
  200863:       00 00                   add    %al,(%rax)
  200865:       00 00                   add    %al,(%rax)
        ...
Unscrambling 0x200858 we see its initial value is 0x4d6 i.e. the next instruction! Which then pushes the value 0 and jumps to 0x4c0. Looking at that code we can see it pushes a value from the GOT, and then jumps to a second value in the GOT:
00000000000004c0 <foo@plt-0x10>:
 4c0:   ff 35 82 03 20 00       pushq  0x200382(%rip)        # 200848 <_GLOBAL_OFFSET_TABLE_+0x8>
 4c6:   ff 25 84 03 20 00       jmpq   *0x200384(%rip)        # 200850 <_GLOBAL_OFFSET_TABLE_+0x10>
 4cc:   0f 1f 40 00             nopl   0x0(%rax)
What's going on here? What's actually happening is lazy binding by convention when the dynamic linker loads a library, it will put an identifier and resolution function into known places in the GOT. Therefore, what happens is roughly this: on the first call of a function, it falls through to call the default stub, which loads the identifier and calls into the dynamic linker, which at that point has enough information to figure out "hey, this libtest.so is trying to find the function foo". It will go ahead and find it, and then patch the address into the GOT such that the next time the original PLT entry is called, it will load the actual address of the function, rather than the lookup stub. Ingenious! Out of this indirection falls another handy thing the ability to modify the symbol binding order. LD_PRELOAD, for example, simply tells the dynamic loader it should insert a library as first to be looked-up for symbols; therefore when the above binding happens if the preloaded library declares a foo, it will be chosen over any other one provided. In summary code should be read-only always, and to make it so that you can still access data from other libraries and call external functions these accesses are indirected through a GOT and PLT which live at compile-time known offsets. In a future post I'll discuss some of the security issues around this implementation, but that post won't make sense unless I can refer back to this one :)

29 April 2011

Ian Wienand: Toolchains, libc and interesting interactions

When building a user space binary, the -lc that gcc inserts into the final link seems pretty straight forward link the C library. As with all things system-library related there is more to investigate. If you look at /usr/lib/libc.so; the "library" that gets linked when you specify -lc, it is not a library as such, but a link script which specifies the libraries to link, which also includes the dynamic linker itself:
$ cat /usr/lib/libc.so
/* GNU ld script
   Use the shared library, but some functions are only in
   the static library, so try that secondarily.  */
OUTPUT_FORMAT(elf64-x86-64)
GROUP ( /lib/libc.so.6 /usr/lib/libc_nonshared.a  AS_NEEDED ( /lib/ld-linux-x86-64.so.2 ) )
On very old glibc's the AS_NEEDED didn't appear; so every binary really did have a DT_NEEDED entry for the dynamic linker itself. This can be somewhat confusing if you're ever doing forensics on an old binary which seems to have these entries for not apparent reason. However, we can see that that /lib/libc.so itself does actually require symbols from the dynamic linker:
$ readelf --dynamic /lib/libc.so.6   grep NEEDED
 0x0000000000000001 (NEEDED)             Shared library: [ld-linux-x86-64.so.2]
Although you're unlikely to encounter it, a broken toolchain can cause havoc if it gets the link order wrong here, because the glibc dynamic linker defines minimal versions of malloc and friends -- you've got a chicken-and-egg problem using libc's malloc before you've loaded it! You can simulate this havoc with something like:
$ cat foo.c
#include <stdio.h>
#include <syslog.h>
int main(void)
 
   syslog(LOG_DEBUG, "hello, world!");
   return 0;
 
$ cat libbroken.so
GROUP ( /lib/ld-linux-x86-64.so.2 )
$ gcc -o -Wall -Wl,-rpath=. -L. -lbroken -g -o foo foo.c
$ ./foo
Inconsistency detected by ld.so: dl-minimal.c: 138: realloc: Assertion  ptr == alloc_last_block' failed!
Depending on various versions of things, you might see that assert or possibly just strange, corrupt output in your logs as syslog calls the wrong malloc. You could debug something like this by asking the dynamic linker to show you its bindings as it resolves them:
$ LD_DEBUG_OUTPUT=foo.txt LD_DEBUG=bindings ./foo
Inconsistency detected by ld.so: dl-minimal.c: 138: realloc: Assertion  ptr == alloc_last_block' failed!
$ cat foo.txt.11360   grep "\ malloc'"
     11360:	binding file /lib/libc.so.6 [0] to /lib64/ld-linux-x86-64.so.2 [0]: normal symbol  malloc' [GLIBC_2.2.5]
     11360:	binding file /lib64/ld-linux-x86-64.so.2 [0] to /lib64/ld-linux-x86-64.so.2 [0]: normal symbol  malloc' [GLIBC_2.2.5]
     11360:	binding file /lib/libc.so.6 [0] to /lib64/ld-linux-x86-64.so.2 [0]: normal symbol  malloc' [GLIBC_2.2.5]
Above, because the dynamic loader comes first in the link order, libc.so.6's malloc has bound to the minimal implementation it provides, rather the full-featured one it provides internally. As an aside, AFAICT, there is really only one reason why a normal library will link against the dynamic loader -- for the thread-local storage support function __tls_get_addr. You can try this yourself:
$ cat tls.c
char __thread *foo;
char* moo(void)  
	return foo;
 
$ gcc -fPIC -o libtls.so -shared tls.c
$ readelf -d ./libtls.so    grep NEED
 0x00000001 (NEEDED)                     Shared library: [libc.so.6]
 0x00000001 (NEEDED)                     Shared library: [ld-linux.so.2]
 0x6ffffffe (VERNEED)                    0x314
 0x6fffffff (VERNEEDNUM)                 2
Thread-local storage is worthy of a book of its own, but the gist is that this support function says "hey, give me an address of foo in libtls.so", the magic being that if the current thread has never accessed foo then it may not actually have any storage for foo yet, so the dynamic linker can allocate some memory for it lazily and then return the right thing. Otherwise, every thread that started would need to reserve room for foo "just in case", even if it never cares about moo. But looking a little closer at the symbols of libc.so is also interesting. libc.so doesn't actually have many functions you can override. You can see what it is possible to override by checking the relocations against the procdure-lookup table (PLT).
Relocation section '.rela.plt' at offset 0x1e770 contains 8 entries:
  Offset          Info           Type           Sym. Value    Sym. Name + Addend
00000035b000  084600000007 R_X86_64_JUMP_SLO 00000000000a2100 sysconf + 0
00000035b008  02e000000007 R_X86_64_JUMP_SLO 0000000000075e50 calloc + 0
00000035b010  01dd00000007 R_X86_64_JUMP_SLO 0000000000077910 realloc + 0
00000035b018  029300000007 R_X86_64_JUMP_SLO 00000000000661c0 feof + 0
00000035b020  046f00000007 R_X86_64_JUMP_SLO 00000000000768c0 malloc + 0
00000035b028  000400000007 R_X86_64_JUMP_SLO 0000000000000000 __tls_get_addr + 0
00000035b030  01b400000007 R_X86_64_JUMP_SLO 0000000000076dd0 memalign + 0
00000035b038  086000000007 R_X86_64_JUMP_SLO 00000000000767e0 free + 0
i.e. instead of jumping directly to the malloc defined in the libc code section, any internal calls will jump to this stub which, the first time, asks the dynamic linker to go out and find the address of malloc (it then saves it, so the second time the stub just jumps to the saved location). This is an interesting list, seemingly without much order. feof, for example, stands out as worth checking out a bit closer why would that be there when fopen isn't, say? We can track down where it comes from with a bit of detective work; knowing that the value of the symbol feof will be placed into 0x35b018 we can disassemble libc.so to see that this address is used by the feof PLT stub at 0x1e870 (luckily, objdump has done the math to offest from the rip for us; i.e. 0x1e876 + 0x33c7a2 = 0x35b018)
000000000001e870 <feof@plt>:
   1e870:       ff 25 a2 c7 33 00       jmpq   *0x33c7a2(%rip)        # 35b018 <_IO_file_jumps+0xb18>
   1e876:       68 03 00 00 00          pushq  $0x3
   1e87b:       e9 b0 ff ff ff          jmpq   1e830 <h_errno+0x1e7dc>
From there we can search for anyone jumping to that address, and find out the caller:
$ objdump --disassemble-all /lib/libc.so.6   grep 1e870
000000000001e870 <feof@plt>:
   1e870:	ff 25 a2 c7 33 00    	jmpq   *0x33c7a2(%rip)        # 35b018 <_IO_file_jumps+0xb18>
   f19f7:	e8 74 ce f2 ff       	callq  1e870 <feof@plt>
$ addr2line -e /lib/libc.so.6 f19f7
/home/aurel32/eglibc/eglibc-2.11.2/sunrpc/bindrsvprt.c:70
Which turns out to be part of a local patch which probably gets things a little wrong, as described below. The sysconf relocation is from a similar add-on patch (being used to find the page size, it seems). libc, like all sensible libraries, uses the hidden attribute on symbols to restrict what is exported by the library. The benefit of this is that when the linker knows you are referencing a hidden symbol it knows that the value can never be overridden, and thus does not need to emit extra code to do indirection just in case you ever wish to redirect the symbols. In the above, it appears that feof has never been marked as hidden, probably because no internal glibc functions used it until that add-on patch, and since it is not considered an internal function the linker must allow for the possibility that it will be overridden at run time and provide a PLT slot for it. There are consequences; if this was on a fast-path then the extra jumps required to go via the PLT may matter for performance and it may also cause strange behaviour if somebody had preloaded something that took over feof. Note, this is different from saying that your library can override symbols provided by libc.so; such as when you LD_PRELOAD a library to wrap an open call. What you can not override is the open call that say, the internal libc.so function getusershell does to read /etc/shells. Having the malloc related calls as preemptable seems intentional and sane; although I can not find a comment to the effect of "we deliberately leave these like this so that users may use alternative malloc implementations", it makes sense so that libc.so is internally using the same malloc as everything else if you choose to use something such as tc-malloc. tl;dr? Digging into your system libraries is always interesting. Be careful with your link order when creating toolchains, and be careful about symbol visibility when you're working with libraries.

14 March 2011

Ian Wienand: Converting DICOM images, part 2

In a previous post I discussed converting medical images. I tried again today and hit another issue which could do with some google help. If you see the following:
$ dcm2pnm --all-frames input.dcm
E: can't change to unencapsulated representation for pixel data
E: can't determine 'PhotometricInterpretation' of decompressed image
E: can't decompress frame 0: Illegal call, perhaps wrong parameters
E: can't convert input pixel data, probably unsupported compression
F: Invalid DICOM image
and dcmdump reports somewhere:
# Dicom-Data-Set
# Used TransferSyntax: JPEG Baseline
Try the dcmj2pnm program, rather than dcm2pnm. The man page does mention this, but that assumes that you know you have a JPEG encoded image :) It works the same, can extract multiple frames and can be converted to a movie as discussed in the previous post. Easy when you know how!

2 March 2011

Ian Wienand: Pyblosxom Recaptcha Plugin

I think maybe the world has moved on from Pyblosxom and, as my logs can attest, spammers seem to have moved on past Recaptcha (even if it is manual). However, maybe there are some other holdouts like myself who will find this plugin useful. In reality, this will do nothing for stopping spam for that I am currently having good luck with Akismet. However, I like that in displaying the captcha it costs the spammers presumably something to crack it so they can even attempt to submit the comment.

Next.

Previous.